Patriot is capable of generating performance monitoring counters to record performance statistics over time. These can be viewed using the built-in windows performance monitor.
Requirements and setup
Before Patriot will report statistics, it will need to be configured using the Utilities Program. Browse to the Patriot client install directory (normally C:\Program Files\Patriot Systems\Patriot Version 6 Client) and select the UtilitiesProgram.exe program. This program will need to be run using an administrative account. On Windows Vista or newer, right-click on the .exe file and select 'Run as Administrator'.
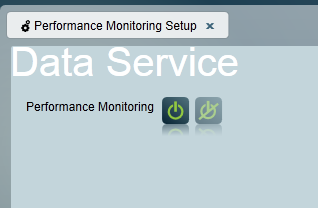
In the Utilities program, select the System Menu->Performance Monitoring->Performance Monitoring Setup item.
Performance monitoring can be enabled at any time, but should only be disabled with the Data Service stopped. Once performance monitoring is enabled, you will need to restart the Data Service before monitoring will begin. Close down all copies of Patriot, stop all Task Services that are running, then restart the Data Service before proceeding. Once the Data Service has been restarted, you can log back in to the clients and start the Task Services again.
Performance Monitoring setup screen
Viewing statistics
Patriot currently offers the following internal statistics that may be useful for troubleshooting or performance monitoring.
General Statistics
Command messages/sec: Mainly used by Patriot support. This shows the number of command messages that are being passed internally between the data service, task service, and clients etc. This includes diagnostic/debug information (such as task raw data) and other internal commands.
RecSig Queue Length: The number of raw signals received by the system which are still waiting for processing and logging. This is a good indication of whether the Patriot server is able to keep up with the number of signals that are arriving at the monitoring station. Generally this number should be quite low.
Signal Log Time: Time taken to log the last logged signal. Helpful for diagnosing system performance issues.
Reminders Processed/sec: Number of background reminders processed during this interval. Helpful for diagnosing system performance issues.
Signal Archive Run Time. Time taken to archive off the last portion of archived signals. Helpful for diagnosing archiving performance issues.
Daily Archive Run Time. Time taken to run the daily archive of non signal data, like work orders and operator maintenance logs etc. Helpful for diagnosing archiving performance issues.
Signal Logging Statistics
Signals Logged: The number of signals processed and logged by the system each sample period. With this statistic you can monitor the total of all signals, and also break it down per action plan, and per receiver port. The list of action plan and ports used since the statistics were configured will be displayed in the instances of the selected object list once you have Signals Logged statistic selected,
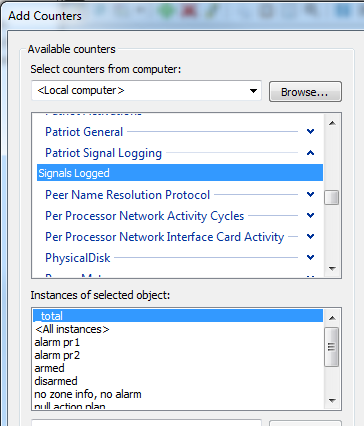
Adding Instance Counters
The per action plan counts can be useful to track a particular category of signals like late to close alarms, AC fails, or no signals alarms. Per port counts can be useful to ensure that a particular port is functional and hasn't gone offline. If you are using multiple ports on the same receiver this will be able to track just one of those ports that may contain all the signals from a particular dealer for example. Per port comparisons can also be made to track if particular linecards in a receiver are overloaded. Both per port and per action plan counters will also be extremely useful when combined with alert levels (see Monitoring Overall System Utilisation below), which can generate alarms back into Patriot when certain conditions are meet, like no signals being received on a particular port.
Activation Statistics
Pending Attends count: The number of outstanding activations active in the system (new un-actioned alarms only). This counter can also shows the number of these new activations per warning time level. With warning timer levels setup correctly for each action plan, monitoring these levels will give a very good quality control overview of your operator response times. Combining these counters with alerts (see Monitoring Overall System Utilisation below) can be used to generate alarms if the operator response times ever fail to meet your minimum standards, or generate warnings if you get close to your minimum standards, giving you a chance to bring on additional staff.
To start viewing performance statistics, open the Windows Control Panel and select Administrative Tools -> Performance Monitor. Select the Performance Monitor screen to view the default statistics. These can be removed or kept as required. Next, click the + button or right-click on the graph and select 'Add Counters'. This page shows all of the available performance categories available in the current server. Patriot's performance counters fall into one of three categories, Patriot General, Patriot Activations, and Patriot Signal Logging. Select the appropriate category and assign the required statistic counters. Once you have selected the counters you require, click ok to return to the graph. The graph will update automatically and show the data. By selecting each statistic in the list, it is possible to get more detailed information such as minimum/maximum/average. It is also possible to hover the mouse over the graph line to see information about a specific point in time, or to toggle the display of each individual statistic by checking and unchecking the 'Show' check-box.
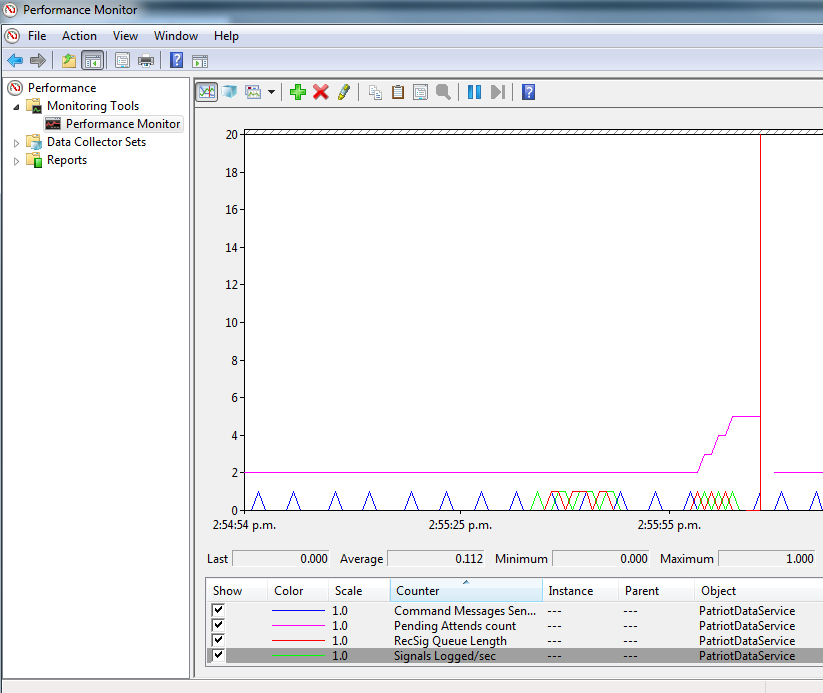
Performance Monitor main screen showing selected Patriot counters.
Task Service Statistics
Tasks Queued Signals: This counter shows the number of signals currently buffered in a particular task service. There could be multiple tasks in one task service and this counter will be cumulative of all the receiving tasks in the particular task service. Normally this queue should remain empty or hover round zero items. If the data service is shutdown or for some reason can't keep up with the task services connected to it the queued signals could climb.
Task Service Tasks Statistics
Signals Logged: This counter shows the number of signals logged per second by the selected Patriot Task. Includes bad data signals.
Bad Data Received: This counter shows the number of bad data signals logged by the selected Patriot Task.
Other Configuration
By default, the performance monitor only shows recent data. For some statistics, it may be more useful to monitor over a longer time period. To do this, right-click on the graph and select 'Properties', or open the Action->Properties menu. On the General tab, it is possible to adjust the sample time and total duration to record as needed.
On the Data tab of the Properties window it is also possible to change the graph colours for each statistic, which may be helpful when monitoring many statistics.
For other information, please consult the Performance Monitor documentation. This is a standard Windows tool and comprehensive information is available online.
Troubleshooting
The Patriot categories do not appear in the list of available categories in Performance Monitor.
Ensure that the category has been created using the Utilities program. If the Performance Monitor was already running when the category was added, it will need to be restarted before the new category will be listed. The categories can also be changed due to a Patriot patch, which will require the Performance Monitors to be setup again using the Utilities program.
No statistics are visible, or the statistics all report 0.
Ensure that the category is up-to-date by using the Utilities program. New statistics may be added to the category in new patches, and the Utilities program setup will need to be run again before performance monitoring can start. The Patriot Data Service will also need to be restarted before it can log statistics, after the category is created or updated.
Cannot load Counter Name data because an invalid index '' was read from the registry
The windows registry relating to Patriots performance monitoring has become corrupt. This section of the registry can be rebuilt using this command, using command prompt with administrative rights,
lodctr /R
It is also possible to set up Data Collector Sets to generate events in Patriot if the total system utilisation exceeds safe limits. The system should not regularly exceed 80% capacity in any of CPU, Network, or Storage usage. These monitors should be set up on any key servers, e.g. SQL server, Patriot server, task servers etc.
First, open the Windows Task Scheduler, from Windows Control Panel -> Administrative Tools -> Task Scheduler.
Select Action -> Create Task.
Enter an easy name, e.g. Patriot Performance Alert
On the actions tab, add a new action:
Action: Start a program.
Program: sqlcmd.exe[1]
Arguments: -S <server>
<auth> -d Patriot -Q "EXEC LogSystemSignal $(Arg0)"
Replace <server> with your SQL server name.
Replace <auth> with your authentication details. For Windows
Authentication, enter -E. For SQL authentication, enter -U
<username> -P <password>
E.g.
-S patserver01 -U sa -P password123 -d Patriot -Q "EXEC
LogSystemSignal $(Arg0)"
OR
-S localhost -E -d Patriot -Q "EXEC LogSystemSignal $(Arg0)"
[1]: If configuring monitoring on a server without SQL installed, the sqlcmd program may not be available. Contact Patriot support for assistance with monitoring additional servers.
Open the Windows Performance Monitor (Windows Control Panel -> Administrative Tools -> Performance Monitor).
Navigate to Data Collector Sets, User Defined. Select Action -> New -> Data Collector Set
Select an easy name, e.g. Patriot Performance Monitor Alerts, and select to Create manually.
Select Create Data Logs as the data type and select Performance Counter.
Change the sample interval to 15 minutes.
Add each of the performance counters below
| Category | Counter |
| Processor | % Processor Time (Total) |
| LogicalDisk | % Free Space[1] |
| Network Adapter | Bytes Total / sec |
Click Finish.
This will record the average CPU, Disk, and Network usage over each 15 minute period, which can then be periodically reviewed.
[1]: If you have multiple disk drives, add a counter for each key drive (e.g. Operating System drive, SQL database drive, backup location drive, etc.)
Next, we will configure the system to generate a Patriot alarm signal if the average usage over the 15 minute period exceeds 80%. The signal will be logged against the SYST client.
| Category | Counter | Alert |
| Processor | % Processor Time (Total) | Above 80 |
| LogicalDisk | % Free Space[1] | Below 20 |
| Network Adapter | Bytes Total / sec | Above Calculated Value[2] |
For each of the counters in the above table:
In your new Data Collector Set, select Action -> New - > Data Collector.
Enter a name, and select Performance Counter Alert as the data type.
Add the counter and set the alert limit as per the above table.
Click Finish, then view the properties for your new collector.
On the Alerts tab, change the Sample Interval to 15 Minutes.
On the Alert Task tab, fill out the fields as follows:
Run this task: Enter the name of the Scheduled task you created above, e.g. Patriot Performance Alert
Task Arguments: {usertext}, '({value}%)'
Task Argument User Text: Enter the Patriot event type you want generated here, e.g. 65506. It is recommended to use a different event type for each alert. Ensure these event types are configured in the SYST client.
Click OK to save the new alert.
[1]: If you have multiple disk drives, add an alert for each key drive (e.g. Operating System drive, SQL database drive, backup location drive, etc.)
[2]: For Network utilisation, a calculation must be done based on your
network capacity. First, determine your available bandwidth capacity in bits
per second. For example, a 100Mbps(Million bits per second) connection has
100,000,000 bits per second of bandwidth. Next, use the calculation
Alert level = 0.8 * (capacity � 8). E.g. for a 100Mbps
connection, the alert level would be 10,000,000 Total Bytes/sec.
Once all alerts and counters are configured, you can start the collector by selecting Action -> Start. You should see the icon change to show that the collector is running.
Next, return to the Task Scheduler. Under the View menu, ensure Show Hidden Tasks is enabled. Now select Microsoft, Windows, PLA. You should see your Performance Alert data set collection shown.
Enter the properties for this set, and select the Triggers tab.
Now, add a new trigger. Select At Startup and click OK.
The data collector will now start up automatically when the server is started, to ensure that alert monitoring is running correctly.
The easiest way to test the alerts is to edit the alert data collectors, and decrease the alert threshold. E.g. changing the Processor limit to 2-5%. You should see the patriot signal logged within 15 minutes. Remember to return the alert threshold to normal after testing is complete.
To review the average usage in each 15 minute block, return to the Performance Monitor. Under Reports, User Defined, will be your Data Collector Set. This folder will show you all saved reports which can be viewed as required.